The nationwide survey was conducted by the Ilko Kucheriv Democratic Initiatives Foundation jointly with the sociological service of the Razumkov Center from July 29 to August 4, 2021, via face-to-face interviews at the respondents’ place of residence. 2019 respondents aged over 18 y.o. were interviewed in all regions of Ukraine, except for Crimea and the occupied territories of the Donetsk and Luhansk oblasts, a sample representative of the adult population according to the key socio-demographic indicators. The theoretical sampling error does not exceed 2.3%. The survey was funded as part of the MATRA project of the Embassy of the Kingdom of the Netherlands.
Chief findings
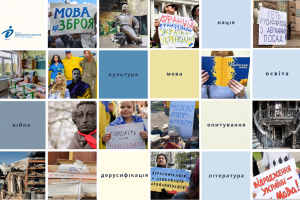
- 55% of the citizens of Ukraine support the requirement for service providers, as part of the “language law”, to communicate with customers in Ukrainian (the communication in other languages remains on option). 21% of respondents do not support the measure, and 18% of Ukrainians do not care about the measure.
The majority of those who support the mandatory communication in Ukrainian by service providers reside in the West and Center – 74% and 62% respectively (11% and 14% respectively are against the measure). In the South and East of Ukraine, the proportion of those who support the measure is 33% and 38% respectively (37% and 33% respectively are against the measure). In both regions the proportion of those who are undecided or do not care about the measure is roughly similar.
The attitude towards the legislation does not correlate with age. As far as political affiliation goes, the chief proponents of the measure support the “European Solidarity” party (74%), the “Servant of the People” party (64%), and the “Fatherland” party (63%). As expected, not as many of those who support the “Opposition Platform – for Life” camp (29%) approve of the measure.
The perception of one’s native language is the crucial factor that defines one’s attitude to the measure. Among those that identify Ukrainian as their native language, 63% of respondents support the measure; among those that identify Russian as their native language, the support for the measure stands at 26%. Further, the perception of one’s native language is a more important factor than the region of the respondents. Among those residents of the South and the East that perceive Ukrainian as their native language, the majority supports the legislation. In contrast, those that believe that Russian is their native language and reside in the West and the Center tend to oppose the measure.
- 59% of citizens of Ukraine believe that service providers use the Ukrainian language more often than they used to (26% of respondents reported a slight increase in the use of Ukrainian, and 33% reported a significant increase). Almost a third of citizens (31%) do not believe that any change took place in this regard.
This increase was reported in all regions of Ukraine. Importantly, a higher proportion of the respondents in the East reported the increase, as compared to other regions – 44% reported a significant increase and 20% reported a slight increase. At the same time, those in the North noted that no changes took place (41%).
- 14% of respondents admit that they adjust their language of communication to that of their conversers (instead of using their native language) whenever possible. Another 41% adjusts their language in some cases. Almost 41% of respondents noted that they do not adjust their language.
In Ukraine, there two most common scenarios of people adjusting their language are as follows: Russian speakers switching to Ukrainian and Ukrainian speakers switching to Russian to match the language of their converser. Another way to approach this issue is to look at the relationship between one’s native language and the language one uses in everyday life.
Often, those who believe that Ukrainian is their native language tend to communicate in Russian. Those who believe that Russian is their native language tend to communicate in Russian (95%). At the same time, among those who believe that Ukrainian is their native language, Ukrainian is used by 77%. This means that almost 20% of all respondents believe that Ukrainian is their native language yet use Russian.
This trend is even more obvious when one considers the regional profile. In the West and Center, respondents mostly communicate in their native language. At the same time, almost half of the residents in the East and South regions that believe that Ukrainian is their native language tend to communicate in Russian in everyday life. This discrepancy shows that in the East and South of the country the perception of Ukrainian as the native language is an identity attribute that does not translate to the use of the language.
- 78% of the Ukrainian citizens believe that their native language is Ukrainian, and 18% of the respondents identify Russian as a native language. In the West and Center, the absolute majority of the respondents believe that Ukrainian is their native language. In the Southern region, 56% of respondents believe that Ukrainian is their native language, and 41% believes that Russian is their native language. In the Eastern region, 56% of respondents believe that Ukrainian is their native language, and 41% believe that Russian is their native language.
The age profile shows that the younger respondents are more likely to identify Ukrainian as their native language. Among those aged between 18 and 29 years old, Ukrainian is considered native among 83% of respondents, and among the older generation (respondents who are aged over 60 years old) – 74%. A similar trend is observed in the South and the East: 64% of respondents in these regions believe that Ukrainian is their native language; yet, only 53% of the older generation believe that Ukrainian is their native language.
The perception of one’s native language depends on one’s type of settlement. Among the respondent who live in cities that have over 1 million residents, 55% of respondents identify Ukrainian as their native language, and 40% of respondents identify Russian as their native language. Among the residents of smaller cities and villages, Ukrainian is identified as the native language more often.
The Russian language is identified more often than the Ukrainian language as native in cities that have over 1 million residents in the South and East of Ukraine (55% - Russian, 36% - Ukrainian). As the same time, in smaller cities and villages in the South and East of the country, Ukrainian is identified as the native language by two thirds of the population (Russian – about a third).
It is likely that age places a factor when it comes to the cities that have over one million residents in the South and East (the youth is more likely to believe that Ukrainian is their native language rather than Russian). However, this hypothesis needs to be assessed as part of a separate study with a larger pool of respondents, because the analysis of this kinds requires evaluating 4 factors: the region, age, type of settlement, and language of respondents. To avoid the lack of data for certain combinations of these factors, at least 2000 of respondents need to participate in the survey.
SURVEY RESULTS
- Do you support the requirement for service providers, as part of the “language law”, to communicate with customers in Ukrainian?
| National average | West | Center | South | East |
| 54,9 | 73,8 | 61,6 | 33,3 | 37,7 |
| 20,9 | 11,1 | 14,1 | 37,1 | 32,5 |
| 17,6 | 7,7 | 19,3 | 23,3 | 21,6 |
| 6,6 | 7,3 | 5,1 | 6,3 | 8,3 |
Age:
| 18-29 y.o. | 30-39 y.o. | 40-49 y.o. | 50-59 y.o. | 60+ y.o. |
| 58,3 | 56,2 | 54,1 | 53,9 | 53,0 |
| 18,4 | 20,0 | 20,8 | 22,2 | 22,6 |
| 17,8 | 18,0 | 18,2 | 17,5 | 17,0 |
| 5,5 | 5,9 | 6,8 | 6,4 | 7,5 |
Political affiliation:
| Servant of the People | Opposition Platform – for Life | European Solidarity | Fatherland |
| 63,9 | 28,8 | 73,6 | 63,0 |
| 15,9 | 46,0 | 13,9 | 15,8 |
| 14,5 | 19,1 | 9,3 | 17,0 |
| 5,8 | 6,0 | 3,2 | 4,2 |
Native language:
| Ukrainian | Russian |
| 62,6 | 26,4 |
| 15,7 | 43,8 |
| 15,9 | 21,5 |
| 5,7 | 8,3 |
Native language by region:
| West-Center | South-East | ||
| Ukrainian | Russian | Ukrainian | Russian |
| 69,1 | 36,5 | 46,3 | 23,6 |
| 10,7 | 41,2 | 28,5 | 44,3 |
| 14,3 | 17,6 | 20,2 | 22,5 |
| 5,9 | 4,7 | 4,9 | 9,6 |
*example: among the residents of the Southern and Eastern regions that identify Ukrainian as their native language, 46,3% approve of the legislation.
2. During the past half a year, do you believe that service providers communicated in the Ukrainian language more often than they used to?
| National average | West | Center | South | East |
| 0,8 | 2,1 | 0,4 | 0,4 | 0,4 |
| 2,1 | 5,2 | 1,8 | 0,4 | 0,8 |
| 25,4 | 23,0 | 31,9 | 21,6 | 19,9 |
| 33,2 | 25,1 | 31,0 | 31,5 | 44,2 |
| 31,3 | 37,6 | 30,3 | 40,7 | 22,9 |
| 7,2 | 7,1 | 4,5 | 5,4 | 11,8 |
3. Do you adjust your language to that of your converser?
| National average | West | Center | South | East |
| 13,9 | 6,3 | 18,1 | 11,6 | 15,6 |
| 41,1 | 33,1 | 51,5 | 25,7 | 40,4 |
| 40,6 | 56,7 | 26,5 | 56,0 | 39,7 |
| 4,4 | 4,0 | 3,9 | 6,6 | 4,3 |
Native language:
| Ukrainian is my native language | Russian is my native language |
| 14,6 | 10,7 |
| 42,9 | 33,3 |
| 38,1 | 51,2 |
| 4,4 | 4,7 |
- The relationship between one’s native language and the language one uses to communicate on a daily basis
| Ukrainian is my native language | Russian is my native language |
| 20,0 | 94,8 |
| 76,9 | 2,8 |
*The sum of the percentages does not equal 100% because the data for the respondents that selected “other” and “do not have an opinion” options is not included due to the lack of data for these categories.
Native language by region:
| West-Center | South-East | ||
| Ukrainian | Russian | Ukrainian | Russian |
| 9,4 | 86,7 | 47,0 | 97,1 |
| 89,5 | 9,6 | 44,5 | 0,7 |
5. Which language do you identify as native?
| National average | West | Center | South | East |
| 18,0 | 1,7 | 9,8 | 40,7 | 34,2 |
| 78,3 | 96,7 | 87,8 | 55,6 | 58,5 |
| 1,1 | 0,4 | 0,3 | 1,7 | 2,6 |
| 2,6 | 1,3 | 2,2 | 2,1 | 4,7 |
Age:
| 18-29 y.o. | 30-39 y.o. | 40-49 y.o. | 50-59 y.o. | 60+ y.o. |
| 13,5 | 17,2 | 15,9 | 18,7 | 22,0 |
| 83,3 | 78,1 | 80,7 | 79,3 | 73,6 |
| 0,3 | 1,5 | 1,1 | 0,6 | 1,6 |
| 2,9 | 3,2 | 2,3 | 1,5 | 2,8 |
Age among the residents of South and East:
| 18-29 y.o. | 30-39 y.o. | 40-49 y.o. | 50-59 y.o. | 60+ y.o. |
| 30,5 | 33,3 | 36,6 | 37,6 | 40,2 |
| 63,6 | 60,0 | 57,3 | 57,9 | 53,1 |
| 0,8 | 3,0 | 2,3 | 1,5 | 3,1 |
| 5,1 | 3,6 | 3,8 | 3,0 | 3,6 |
Settlement type:
| Population over 1 million | Population between 100 thousand and 1 million | Population less than 100 thousand | Small towns and villages |
| 39,5 | 19,7 | 14,6 | 9,8 |
| 54,5 | 76,2 | 81,6 | 87,9 |
| 1,1 | 2,4 | 0,5 | 0,8 |
| 4,8 | 1,7 | 3,3 | 1,4 |
Settlement type among the residents of East and South regions:
| Population over 1 million | Population between 100 thousand and 1 million | Population less than 100 thousand | Small towns and villages |
| 54,5 | 37,4 | 34,3 | 22,6 |
| 35,9 | 57,3 | 58,0 | 73,9 |
| 2,0 | 5,3 | 1,4 | 1,5 |
| 7,6 |
| 6,3 |
|